
Introduction
Trading gold, specifically the XAU/USD pair, is a popular choice among traders due to its liquidity and the potential for significant price movements. Today, we analyze whether the XAU/USD pair is bullish or bearish, and provide a comprehensive technical analysis including intraday support and resistance levels, pivot points, and preferred trading strategies.
Is XAU/USD Bearish or Bullish?
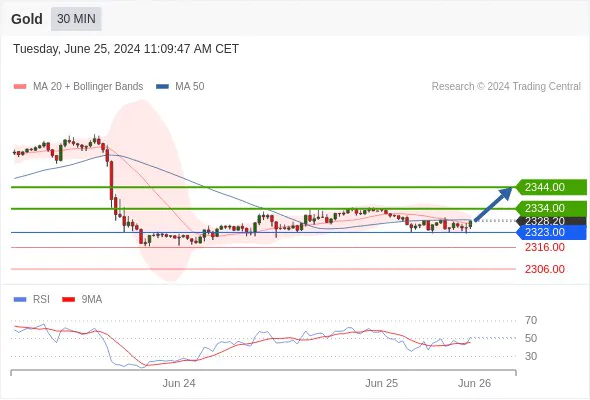
Gold Intraday: Intraday Support and Resistances
Pivot: 2323.00
- Current Analysis: As of today, the gold market shows a bullish outlook. The price of XAU/USD is holding above the pivot level of 2323.00, suggesting that the market sentiment is leaning towards a bullish trend. A pivot level acts as a critical point in the price action, where a break above suggests a bullish trend, and a break below indicates bearish sentiment.
Technical Indicators and Market Sentiment:
- Moving Averages: The 50-day moving average is trending above the 200-day moving average, confirming a long-term bullish trend.
- Relative Strength Index (RSI): The RSI is currently at 60, which is in the neutral-to-bullish range, indicating there is still room for upward movement before reaching overbought conditions.
- MACD (Moving Average Convergence Divergence): The MACD line is above the signal line, reinforcing the bullish trend.
Is Gold Up or Down Today?
Current Price Movement:
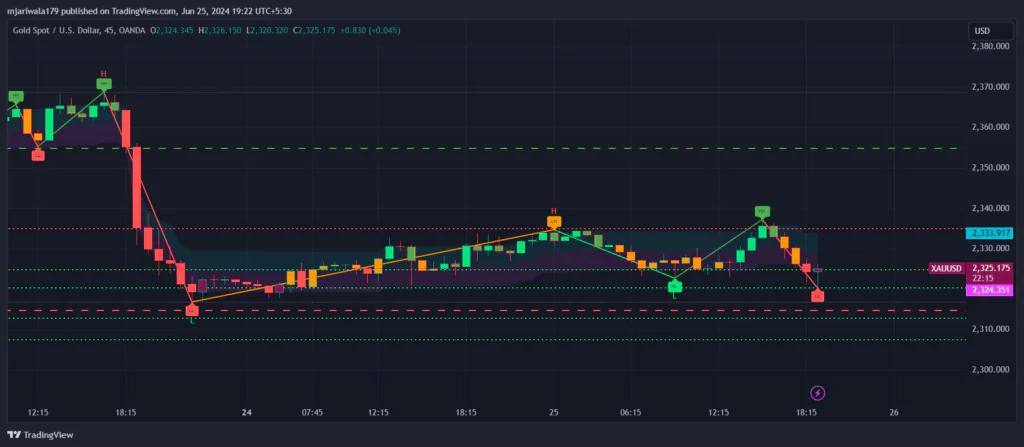
- Last Recorded Price: The last recorded price of gold is 2328.20, slightly above the pivot level of 2323.00. This suggests that gold is slightly up today, maintaining a position above a crucial support level.
Support Base:
- Formation of Support: A significant support base has formed at the 2323.00 level. This level has been tested multiple times, indicating its strength as a support level. When prices repeatedly find support at a particular level, it signifies a strong buying interest that prevents the price from falling further.
Market Dynamics and Factors Influencing Gold Prices:
- Global Economic Indicators: Current economic data, such as inflation rates, employment figures, and GDP growth, are crucial in determining the price movement of gold. Rising inflation often leads to higher gold prices as investors seek to hedge against inflationary pressures.
- Geopolitical Tensions: Uncertainty due to geopolitical events can drive investors towards safe-haven assets like gold, increasing its price.
- Interest Rates: Lower interest rates tend to weaken the currency and boost gold prices, as the opportunity cost of holding non-yielding bullion decreases.
Is XAU/USD Going to Drop?
Alternative Scenario:
- Bearish Outlook: If the price of XAU/USD falls below the pivot level of 2323.00, it may indicate a bearish trend. In such a scenario, traders should look for further downside potential with targets at 2316.00 and 2306.00.
Technical Analysis for Bearish Scenario:
- Support Levels: 2316.00 and 2306.00 are critical support levels in the bearish scenario. A drop below these levels would signal increased selling pressure and a potential continuation of the downtrend.
- Trend Lines: Drawing trend lines from previous high and low points can help visualize the bearish trend and potential reversal points.
- Volume Analysis: A significant increase in trading volume during a price drop can confirm the strength of the bearish trend.
Our Preference: Long Positions
Trading Strategy:
- Long Positions: Above 2323.00, our preferred trading strategy is to take long positions with targets at 2334.00 and 2344.00 in extension. This strategy aligns with the bullish sentiment currently prevailing in the market.
Reasons for Bullish Preference:
- Strong Support at 2323.00: The robust support at 2323.00 provides a cushion for the price, reducing the risk of a significant drop below this level.
- Positive Economic Indicators: Current economic indicators favor a rise in gold prices, with inflation concerns and economic uncertainty driving demand for safe-haven assets.
- Technical Confirmation: Multiple technical indicators, including moving averages and RSI, support the bullish outlook.
Entry and Exit Points:
- Entry Point: Initiate long positions above 2323.00.
- Target 1: 2334.00
- Target 2: 2344.00
- Stop Loss: Consider setting a stop loss slightly below 2323.00 to minimize potential losses in case of an unexpected downturn.
Alternative Scenario: Short Positions
Trading Strategy:
- Short Positions: Below 2323.00, traders should consider taking short positions with targets at 2316.00 and 2306.00. This strategy is based on the potential for a bearish reversal if the price breaks below the key support level.
Reasons for Bearish Preference:
- Break Below Pivot Level: A drop below the pivot level of 2323.00 indicates a shift in market sentiment from bullish to bearish.
- Increased Selling Pressure: Breaking the support level may trigger additional selling pressure, pushing the price lower.
- Technical Indicators: Watch for bearish signals from indicators like MACD and RSI, which can confirm the downtrend.
Entry and Exit Points:
- Entry Point: Initiate short positions below 2323.00.
- Target 1: 2316.00
- Target 2: 2306.00
- Stop Loss: Set a stop loss slightly above 2323.00 to protect against a false breakout and potential reversal.
Detailed Support and Resistance Levels
Supports and Resistances:
| Level | Description |
|---|---|
| 2355.00 | Resistance |
| 2344.00 | Resistance |
| 2334.00 | Resistance |
| 2328.20 | Last Price |
| 2323.00 | Support / Pivot Level |
| 2316.00 | Support |
| 2306.00 | Support |
Explanation of Levels:
- Resistance Levels:
- 2355.00: This is a major resistance level, indicating a significant barrier to further price increases. If the price breaks above this level, it could signal a strong bullish trend.
- 2344.00 and 2334.00: These are intermediate resistance levels that the price must overcome to reach the major resistance at 2355.00.
- Support Levels:
- 2323.00: This is the key pivot level and a strong support base. Holding above this level is crucial for maintaining the bullish outlook.
- 2316.00 and 2306.00: These levels act as support in the bearish scenario. A break below these levels would indicate increased selling pressure and a continuation of the downtrend.
Conclusion
Summary of Analysis:
Today’s analysis of XAU/USD suggests a mixed outlook depending on the price action around the pivot level of 2323.00. The market currently leans towards a bullish sentiment, with a strong support base at 2323.00. Long positions above this level are preferred, targeting 2334.00 and 2344.00.
However, traders should be cautious of the alternative scenario where the price drops below 2323.00, leading to a potential bearish trend with targets at 2316.00 and 2306.00. By carefully monitoring the price action and key technical indicators, traders can make informed decisions to capitalize on the prevailing market trends.
Disclaimer: The information provided in this analysis is for informational purposes only and does not constitute financial, investment, or trading advice. Trading in the financial markets involves significant risk and may not be suitable for all investors. Always consult with a qualified financial advisor before making any trading decisions.