
Gold remains one of the most traded commodities in the forex market, offering numerous opportunities for intraday traders. Whether you are a seasoned trader or a novice, understanding the key levels of support and resistance is crucial for successful trading. This article delves into the intricacies of gold intraday trading, providing actionable tips and insights to help you navigate the market effectively.
Gold Intraday Trading: Overview
Gold, often seen as a safe-haven asset, is influenced by various economic indicators and geopolitical events. Intraday traders capitalize on the price movements within the day, making quick trades based on technical analysis and market sentiment.
Bullish Bias Above 2332.00
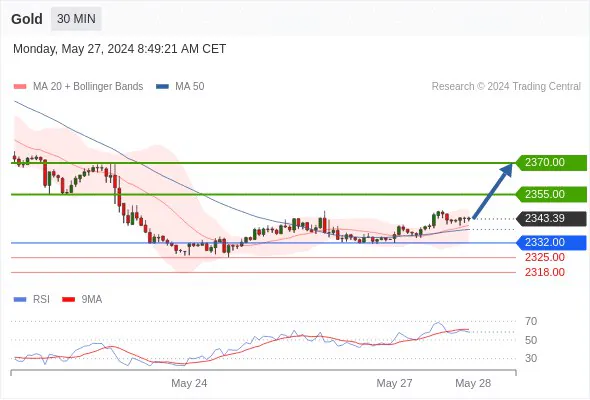
In the current market scenario, gold exhibits a bullish bias when trading above the pivot level of 2332.00. This indicates a potential upward trend, providing opportunities for long positions. Here’s a detailed analysis of our trading strategy and key levels to watch.
Our Preference: Long Positions Above 2332.00
Entry Point: Above 2332.00
Targets: 2355.00 (Primary), 2370.00 (Extension)
When gold is trading above 2332.00, we recommend taking long positions, aiming for an initial target of 2355.00. If the bullish momentum continues, the price could extend to 2370.00, offering a more significant profit potential.
Alternative Scenario: Below 2332.00
Entry Point: Below 2332.00
Targets: 2325.00 (Primary), 2318.00 (Secondary)
If gold falls below the pivot level of 2332.00, it could signal a further downside. In this scenario, traders should look for targets at 2325.00 and potentially down to 2318.00.
Comment on RSI
The Relative Strength Index (RSI) is currently indicating a bounce, suggesting a potential upward movement. Traders should monitor RSI values alongside other indicators to confirm entry and exit points.
Key Supports and Resistances
Understanding the key levels of support and resistance can significantly improve your trading strategy. Here’s a detailed table of the critical levels to watch in the current market.
| Level | Type | Price |
|---|---|---|
| Resistance | Key Level | 2384.00 |
| Resistance | Target | 2370.00 |
| Resistance | Primary | 2355.00 |
| Current | Last Price | 2343.40 |
| Pivot | Key Level | 2332.00 |
| Support | Primary | 2325.00 |
| Support | Secondary | 2318.00 |
Chart Analysis
Analyzing gold price charts is essential for making informed trading decisions. Here’s a step-by-step approach to conducting a thorough chart analysis:
- Identify Trends: Look for overall market trends (upward, downward, or sideways). Use trend lines and moving averages to confirm the direction.
- Mark Key Levels: Draw horizontal lines at significant support and resistance levels as identified in the table above.
- Use Indicators: Apply technical indicators such as RSI, MACD, and Bollinger Bands to gauge market momentum and volatility.
- Check Volume: Analyze trading volumes to understand the strength of price movements. High volume during price increases or decreases can confirm trends.
- Watch for Patterns: Identify candlestick patterns (e.g., doji, hammer, engulfing) that may indicate potential reversals or continuations.
Conclusion
Gold intraday trading requires a keen understanding of technical analysis and market dynamics. By focusing on key support and resistance levels, and staying informed about market sentiment, traders can make more informed decisions. Always remember to monitor the RSI and other indicators to confirm your trading strategies. Happy trading!